- hg19
- 215 996
- 2
- 824
- 824
- v4.1
File Data
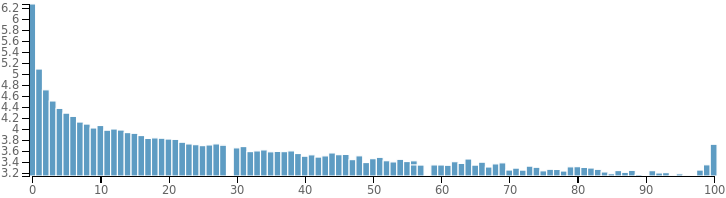
Site Frequency Distribution
Also called allele frequency spectrum, refers to the distribution of the allele frequencies of a set of loci (typically SNPs) in a population or sample. It is a histogram which depends on the number of samples used for its calculation and therefore, it is significant if a high number of samples are used. Sometimes, variant callers use human databases of variants as a control to get an idea about the expected frequencies. A good plot should be similar to an exponential distribution like the one shown below:
Variant types
This plot shows which kind of variant types are present in the VCF file. SNPs are the most common variant expected to be detected. The proportion among the different types (Ins for insertions and Del for deletions) may vary according to the kind of experiment performed, being more variant types in whole sequencing data than in exome data as big changes may be more deleterious. Other variant types may comprise when a combination of SNP and deletion occurs (i.e. Ref: ACGT → CCG).
The purpose of this plot is just informative as it allows to check if the VCF has been filtered and to detect which variants are not present in a first view.
Ts/Tv: 1.71
Transversion is defined as a point mutation of the DNA sequence that makes a change of purine (Adenine & Guanine) to pyrimidine (Cytosine & Thymine) or vice versa. Pyrimidines are characterized in having a double ring while purines do have one.
Transition occurs when the mutation is between the same kind of bases (purine to purine or pyrimidine to pyrimidine). Transitions are less likely to turn in amino acid substitutions and may persist as “silent substitutions” as single nucleotide polymorphisms (SNPs).
Transitions occur approximately 10 times more often than transversions as changing a single structure is more likely than changing a double ring to a single ring. Also, it is important to notice that transversions usually have more effect than a transition as the third position of the amino acid code is more tolerant to transitions than transversions, i.e. transition may derive in the same amino acid.
So, finally for Human DNA is expected to obtain a Ts/Tv ratio close to 2. If it is lower, it means a probable signal of data problems.
Base Changes
As explained in the Ts/Tv Ratio info, transitions are 10 times more probable than transversions. That means it is more likely the Adenine to mutate into Guanine or vice versa than to mutate either a Cytosine (C) or Thymine (T). The plot should be similar to the following one:
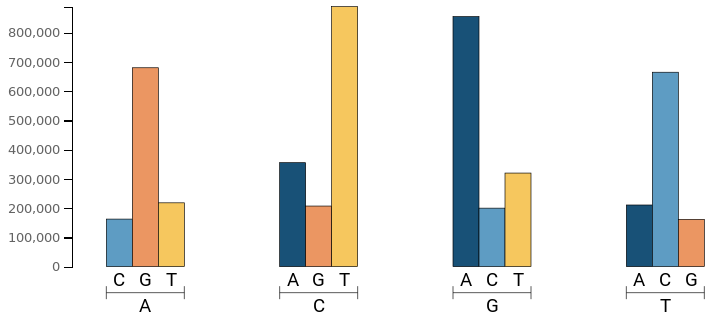
A deviation of this model may indicate a problem with the variant calling, and probably the Ts/Tv ratio will be lower than 2.
Indel Distribution
This plot allows checking the number of insertions and deletions according to length observed in the VCF. Negative values represent deletions and positive values correspond to insertions. The x-axis shows the number of bases inserted/deleted and the y-axis corresponds to the number of variants observed having those amount of bases inserted/deleted. Usually, more deletions than insertions are observed, and the length of the indels are generally very short (1-5 bases).
Quality Distribution
Represents the phred-scaled quality score for the assertion made in ALT. It corresponds to the QUAL (6th column) in the vcf file. Higher it is the more confident we are. Notice that this value can be not only platform biased but also variant calling tools may get different values so you should be aware of that. Here we mainly want to verify that the quality scores are not crowded into the low (< 100) end. Deviations may indicate problems within the analysis/experiment.